
Table of contents
- Understanding engagement rate
- Importance of measuring website engagement rate
- Key engagement metrics for websites
- 1. Pageviews
- 2. Sessions
- 3. Visit duration
- 4. Bounce rate
- 5. Events
- Importance of measuring product engagement rate
- Key engagement metrics for products
- 1. Active users (DAU and MAU)
- 2. Users stickiness metrics
- 3. Company stickiness metrics
- 4. Most engaged users
- 5. Feature adoption
- Conclusion
- FAQs
Engagement Rate: Importance and Key Metrics
Jan 12, 2024
9 mins read
How much do people love your website or product?
Want any clue?
That's where engagement rates step in – they're like your online applause meter, showing how much your audience is into what you're offering.
Why is this a big deal?
Well, it's the secret sauce to make your website and product a big hit. When visitors click, comment, or share info about your product, it's like a digital high-five; they could become loyal customers.
But how?
In this comprehensive blog post, we will delve into the significance of measuring engagement rates and why these are important.
Without further ado, let’s get started.
Understanding engagement rate
Think of the engagement rate as a way to see how interested people are in what you're offering. It's not just about counting views or downloads but also about checking if users are doing things like liking, sharing, commenting, and spending time on your site or product.
In simpler terms, it helps you understand if people are just looking at your content or actively participating and spending time, giving you a clearer picture of how much they enjoy and engage with what you offer.
Importance of measuring website engagement rate
Measuring your website's engagement rate is like peering into the heartbeat of your online presence. It goes beyond mere visits, offering insights into how actively visitors interact with your content.
A high engagement rate indicates a captivated audience, potentially leading to increased conversions, loyalty, and overall success. Regularly tracking this metric is key to refining your online strategy and ensuring your website remains a vibrant and compelling hub for your audience.

Measuring website engagement rate can help in a number of ways like;
1. User satisfaction and loyalty
A high engagement rate indicates that visitors find your website valuable and are actively interacting with its content. It's a reflection of user satisfaction and can contribute to building a loyal audience.
2. Content effectiveness
Measuring engagement helps in evaluating the effectiveness of your content strategy. Are users reading articles, watching videos, or interacting with your widgets? This information is invaluable for refining your content to meet user expectations.
3. Conversion potential
Engagement often correlates with conversion. The more engaged users are, the more likely they are to convert into customers, subscribers, or participants.
4. Ad revenue
For websites relying on advertising, engagement rate is a critical metric. Advertisers prefer websites with an engaged audience as it ensures their content reaches an active and interested user base.

Key engagement metrics for websites
In marketing, people talk a lot about getting more visitors (traffic). But to really know how good your website is, you need to look at something else – how people engage with it.
Traffic is like claps for your efforts, but to understand your website, you need engagement metrics.
The key metrics that you should include while calculating engagement of a website are generally;
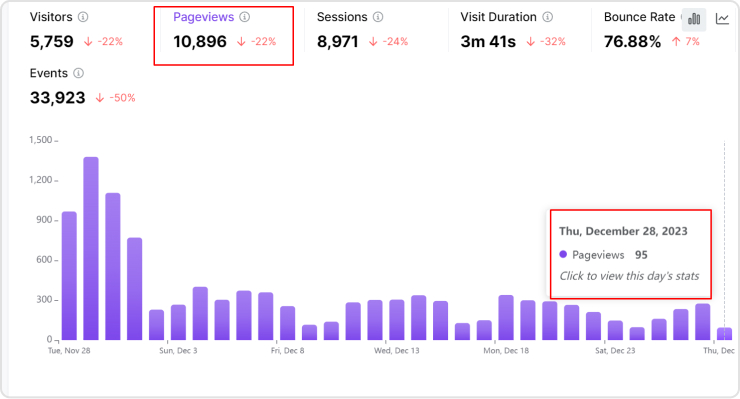
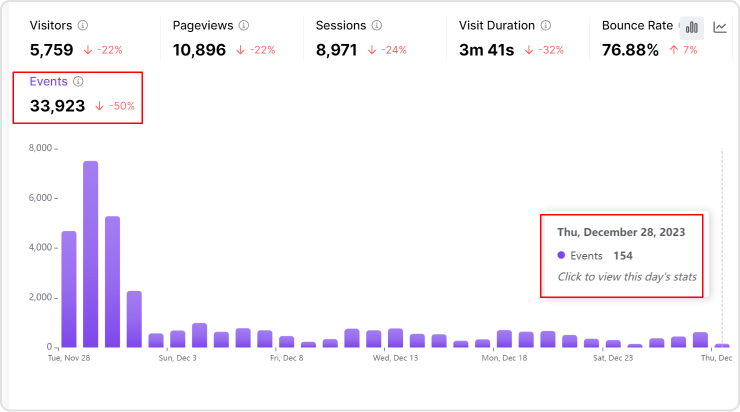
1. Pageviews
Pageviews, a fundamental metric, quantify the total number of pages visitors access on your website. It serves as a pivotal measure for overall traffic and user interaction.
Importance
- Traffic assessment: Pageviews offers a broad understanding of website interactions, aiding in assessing the overall traffic.
- Content popularity: By identifying frequently visited pages, you can gauge user interest and adapt your content strategy accordingly.
- Ad campaign reach: Useful for evaluating the impact and reach of advertising efforts across different pages.
How to track?
Usermaven seamlessly leverages pageviews to offer insights into traffic patterns, helping identify popular content areas organically.
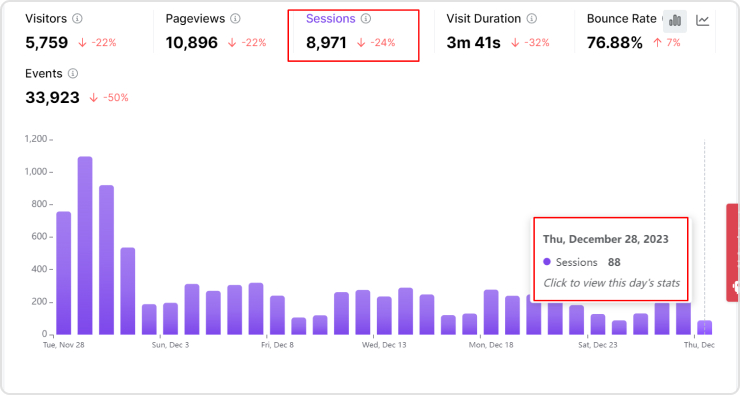
2. Sessions
Sessions signify the total number of visits or interactions on your website within a specific timeframe. This metric is instrumental in estimating the intensity and frequency of user engagement.
Importance
- Engagement intensity: Measures how deeply users interact during a visit, providing insights into user engagement quality.
- Visitor frequency: Reflects how often users return to the site, indicating the loyalty and recurring interest of the audience.
- Conversion insight: Essential for understanding user behavior leading to conversions and optimizing the user journey.
How to track?
Website analytics tools like Usermaven effectively analyze sessions for user engagement frequency, offering valuable data for conversion optimization in a natural manner.
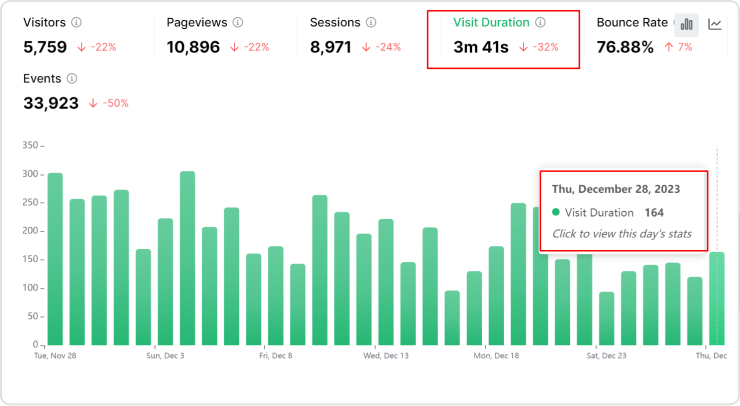
3. Visit duration
Visit duration indicates the time a visitor spends on your website during a session, offering insights into content engagement and user interest.
Related: A step-by-step guide to identify website visitor sources
Importance
- Content engagement quality: Longer visit durations indicate more engaging content, helping to identify popular and valuable sections.
- User intent alignment: Reflects how well content aligns with user expectations, aiding in content optimization.
- Page stickiness: Measures the ability of the site to hold visitor attention, contributing to a positive user experience.
How to track?
Visit duration is a crucial parameter in Usermaven's toolkit, utilized to assess content engagement quality and provide actionable insights for improving the overall user experience.
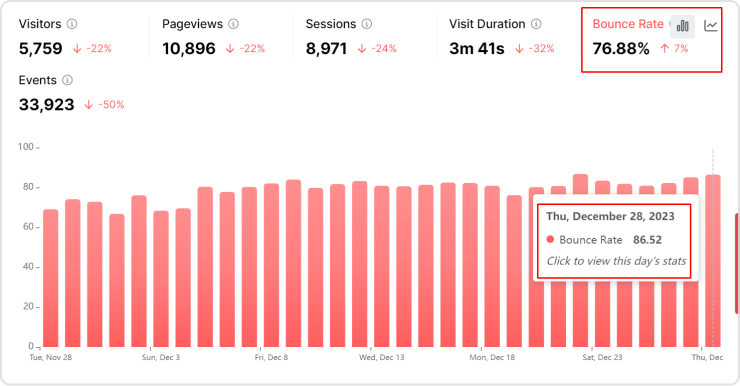
4. Bounce rate
The bounce rate represents the percentage of visitors who navigate away from your site after viewing only one page. It serves as a critical metric for understanding the immediate user response.
Importance
- Content relevance: High bounce rates may indicate a content mismatch with user intent, highlighting areas for improvement.
- User experience: Reflects the initial impression and usability of the landing page, offering insights into potential friction points.
- Conversion optimization: Identifies pages needing improvement to retain visitors and enhance overall conversion rates.
How to track?
Usermaven uses bounce rate data to find pages with a lot of people leaving quickly. This helps website owners improve content and user experience naturally.
5. Events
Events track specific user interactions on a website, such as clicks, downloads, or video views. This metric goes beyond pageviews, providing a more detailed understanding of user engagement.
Importance
- User interaction tracking: Measures specific actions beyond basic pageviews, offering a detailed view of user engagement.
- Conversion path analysis: Provides insights into user journeys, helping understand the steps users take before completing a desired action.
- Goal tracking: Essential for assessing the success of specific actions or campaigns, contributing to strategic planning.
How to track?
In many digital analytics platforms like Usermaven, events are crucial. They track how users interact, figure out conversion paths, and check the success of specific actions or campaigns in a natural and integrated way.
Importance of measuring product engagement rate

Understanding how much people like and use your product is key. It helps you tweak and make your product better, ensuring it's something people really enjoy and find valuable.
Insights from product engagement metrics are invaluable. They measure every user interaction, from downloads to long-term customer value. This data shapes your product development, product launches, and marketing strategies, all influencing your overall success.
Product engagement rate can help in a number of ways like;
1. Enhanced user experience
For products, measuring engagement is paramount for enhancing the user experience. Understanding how users interact with features helps in optimizing the product for better usability.
2. Feature prioritization
Knowing which features are most engaging enables product managers to prioritize updates and improvements based on user preferences.
Related: 9 key marketing insights for product managers
3. Customer retention
Engagement metrics for products play a vital role in predicting and improving customer retention. Products that keep users engaged are more likely to retain them over time.

Key engagement metrics for products
Product engagement metrics are quantitative insights that measure how users interact with a product.
These metrics help product developers and teams understand how people like their products and discover patterns in user behavior. This information is crucial for turning users into power users and keeping them interested in the product over time.
There are several key engagement metrics that should be tracked, including;
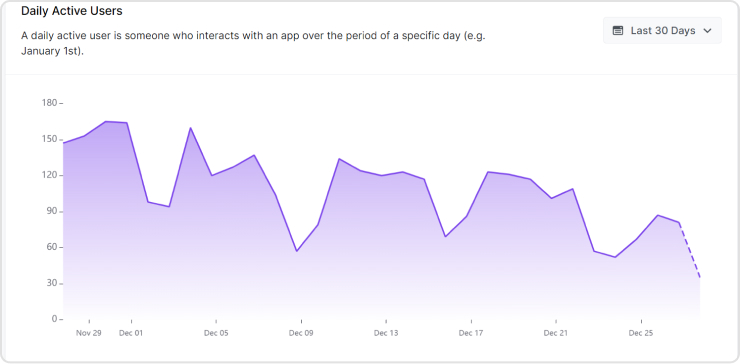
1. Active users (DAU and MAU)
Daily active users (DAU) and monthly active users (MAU) are crucial metrics for assessing user engagement. DAU measures the number of users interacting with the product on a daily basis, providing insights into short-term engagement trends. MAU, on the other hand, offers a broader perspective by indicating the number of users engaged with the product over a month.
How to track?
For Instance, Usermaven enhances the understanding of active users by providing detailed user behavior analysis. The platform utilizes its analytics capabilities to segment users based on various parameters, helping identify patterns and preferences that contribute to higher DAU and MAU figures.
Its user-friendly interface ensures that product managers can easily interpret and act upon the insights derived from these metrics.
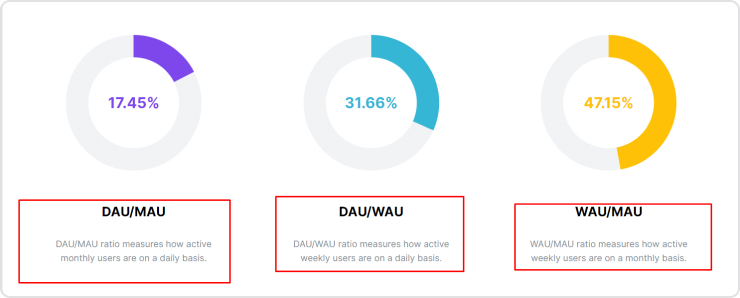
2. Users stickiness metrics
User stickiness metrics, such as the DAU/MAU ratio, assess the frequency of user engagement relative to the overall user base. A higher stickiness ratio indicates that users are consistently returning to the product within a given timeframe.
How to track?
Many product analytics tools like Usermaven employ advanced segmentation to understand the factors contributing to stickiness.
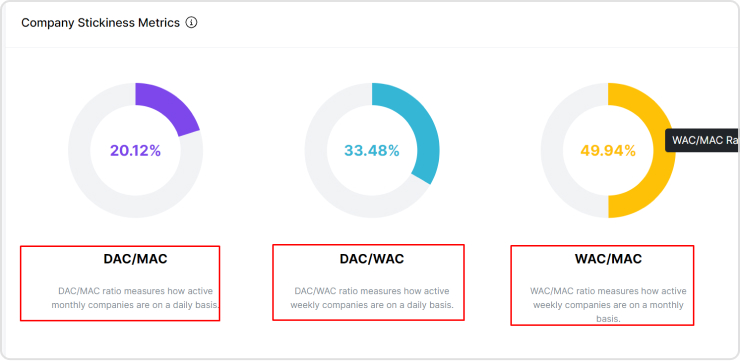
3. Company stickiness metrics
Company stickiness metrics measure the loyalty of users to the brand or product. It assesses how likely users are to remain engaged with the product over an extended period.
How to track?
Usermaven facilitates the evaluation of company stickiness by providing insights into user satisfaction and preferences.
4. Most engaged users
Identifying the most engaged users helps in understanding the core user base that drives the product's success. These users are instrumental in providing insights into feature preferences and usage patterns.
How to track?
Usermaven's product analytics kit provides a list of the most engaged users.

Additionally, Usermaven has recently introduced a new engagement column in the contacts hub, which provides an overview of four different engagement levels in the contacts hub: highly active, moderately active, low, and at risk.

5. Feature adoption
Feature adoption measures how users embrace and utilize new or existing features within the app. A high feature adoption rate indicates that users are finding value in the product's features. It also allows companies to generate more revenue by ensuring customers see the product's maximum value.
How to track?
Usermaven's feature adoption 2.0 enhances product insights by allowing users to organize features into modules and define adoption and retention criteria based on user event frequency.
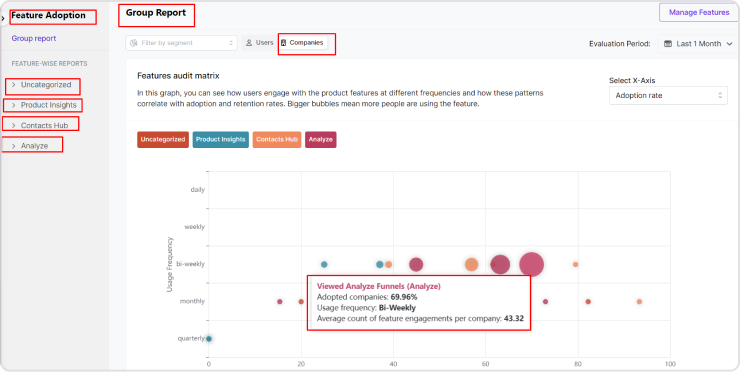
The update provides comprehensive reporting for a quick overview of feature utilization, improved tracking of "adopted" and "retained" users, and an enhanced user experience. It simplifies the process of creating feature reports, offering flexibility in feature organization for efficient analysis.
Conclusion
In short, engagement rate tells businesses how well people like their content. To make it better, they need to know their audience, make good content, and keep an eye on things like user activity and page views.
By looking at these numbers and using smart strategies, businesses can make users happier, keep them around, and become more successful.
Usermaven helps businesses understand their users' engagement levels and behavior, which can lead to better retention rates and sustained product success.
Try Usermaven to calculate the engagement rate!
FAQs
1. What is a good engagement rate for a website?
A good engagement rate varies by industry and platform but generally falls between 2% and 5%. It's essential to benchmark against your industry and continually strive for improvement.
2. Do views count as engagement?
While views are a form of engagement, they are not the only metric to consider. True engagement involves meaningful interactions such as likes, comments, and shares, providing a more comprehensive picture.
3. Why is engagement better than reach?
Engagement goes beyond reach by focusing on the quality of interactions rather than sheer numbers. A highly engaged audience is more likely to convert, making engagement a more valuable metric for assessing the impact of your content or product.

Know what's happening at every touchpoint of your users’ journey with AI-powered analytics.
It's 100% Free to Try!